Robert J. Barro is Paul M. Warburg Professor of Economics at Harvard University, a senior fellow of the Hoover Institution of Stanford University, and a research associate of the National Bureau of Economic Research. He is the third-ranked economist in the world, according to RePEc.
Dear Professor Barro:
I’m compelled to write after following your writings for many years, in response to your recent article (PDF) in the Wall Street Journal, your interview with Conor Clark on the Atlantic web site, and your published email interchange with Clive Crook on his Atlantic blog.
In 2000 you demonstrated that in OECD and Rich countries, government consumption levels have no significant correlation to long-term growth rates. (PDF)
In their 2003 meta-analysis (PDF), Nijkamp and Poot demonstrated (with multiple references to your works) that in aggregate, dozens of your colleagues who have actually studied this issue support those results–in spades.
In prosperous, developed countries, smaller government does not yield faster growth. As you and your colleagues have demonstrated, that belief is a myth. (The U.S. has been taxing about 28% of GDP for decades–local, state, and federal combined. Europe has been taxing 40%. But growth rates have been the same.)
But you have constantly promulgated that myth–and you continue to do so–in your scholarly and popular writings, and public pronouncements. This is especially concerning because your statements receive widespread attention and credence regarding taxation and spending policies in the U.S.–which is a decidedly rich country.
Facts on the ground:
In your 2000 paper you broke out growth rates for a panel of Rich countries, of OECD countries, and of Poor countries (PDF: table 1.1, page 35). Results:
Correlations: Government consumption versus growth in real GDP per capita
Rich-countries: -.014 (.042)
OECD-countries: .015 (.040)
Poor countries: -.167 (.030)
All countries: -.157 (.022)
For prosperous countries the results are one positive (more government consumption, faster growth), one negative, neither even vaguely significant.
Only the poor-country panel shows significance. So the negative correlation for the overall sample is completely dominated by the poor-country results. (Not surprisingly: The correlation for poor countries is relatively large, and poor countries in the sample–which are weighted equally with rich countries–greatly outnumber the rich countries.)
As far as I can determine, your 2000 findings regarding rich versus poor countries have been completely absent from your other (widely-cited) works in the field.* Your conclusions in those works have been based on your full sample of approximately 100 countries, which is dominated by poor countries.
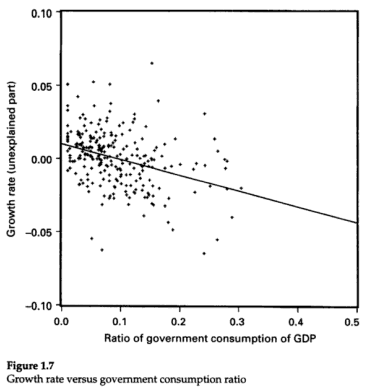
You consistently state that greater government consumption reduces growth rates, with some iteration of the following graph.

Even in your 2000 paper, you make no mention of your own findings therein, but rather make the following blanket–and importantly misrepresentative–statement (page 12).
Table 1, column 1 indicates that the effect of the government consumption ratio, G/Y [consumption as a percent of GDP –Steve], on growth is significantly negative. The coefficient estimate implies that an increase in G/Y of 10 percentage points would reduce the growth rate on impact by 1.6% per year.
What about columns 3, 4, and 5? Is this statement true for prosperous countries like the U.S.? And is it wise to make recommendations about U.S. policy based on findings dominated by countries like Thailand and Mozambique?
Can you explain why you have ignored your own findings–seemingly swept them under the rug–and consistently made statements contradicted both by those findings and by the aggregate findings of your colleagues who have–like you–actually studied this issue?
Thanks,
Steve
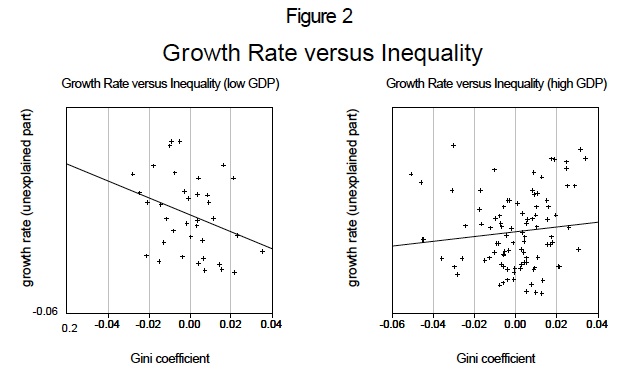
P.S. (Added 10/24/09): I just went to look at your 1999 paper “Inequality and Growth in a Panel of Countries” (PDF). I notice that in this case you do show results for rich vs poor countries. You conclude that over all the countries surveyed, there’s essentially no correlation, while finding negative correlation for poor countries (more unequal, slower growth) and a smaller positive correlation for richer countries (more unequal, higher growth).
These two graphs stand eloquently alone on the last page of the paper.

These graphs are conspicuously absent from your papers on government size versus growth. Do you only present (and highlight) these results when they support views that–judging by your pronouncements detailed above–you want to agree with?
* I’ve gone back through much of your work, but the key works on this subject are Determinants of Economic Growth (1998), “Recent Developments in Endogenous Growth Theory” (chapter, 2000), Economic Growth in a Cross Section of Countries (2001), and Economic Growth (2003).
Comments
4 responses to “An Open Letter to Robert Barro”
did barro ever respond to your open letter?
bob: ” did barro ever respond to your open letter? ”
No, nothing yet…
[…] also went back to the most widely-cited paper on this topic, Robert Barro’s 2000 “Inequality and Growth in a Panel of Countries” (PDF). He concludes that […]
[…] prompts me to republish an open letter to Professor Barro that I posted some years ago. (To which, not surprisingly, I never received a […]