Update June 2012: See data through 2010 here.
People love to cherry-pick statistics to show that the US, or Europe, is winning the growth game. That got me curious: if you look at all the possible growth periods, who’s ahead (most)? Short answer: no clear winner. The results look pretty random. Over the longest periods, Europe is consistently ahead. But some shorter but still lengthy periods give the US the advantage.
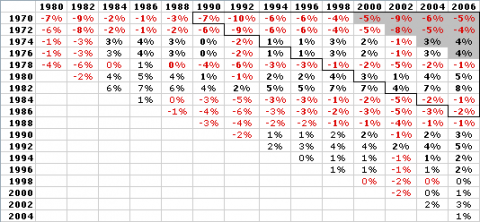
Change in real GDP per capita (PPP), difference between EU and US
US growth percentage minus EU15 growth percentage (positive numbers=US ahead)
Starting years at left, ending years, top. Gray is >29 years. Outline is >19 years.

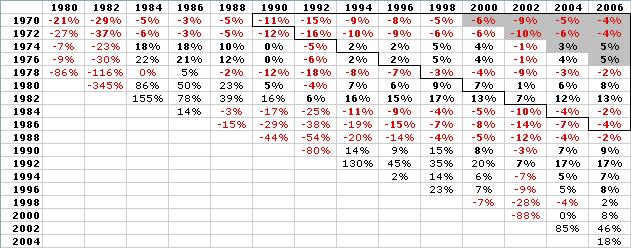
Here’s the same table expressed as a percentage difference.
(US growth %-EU growth%)/EU growth %

All data is from the OECD. I just did the arithmetic.
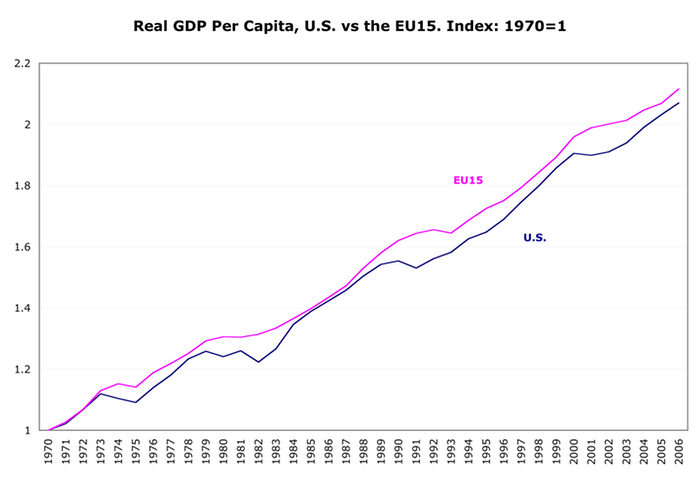
Update 10-5-2010: The tables above are great for demonstrating the danger of cherry-picking periods, but a graphic provides a more immediately-apprehensible understanding of the long flow of history:
Given the inherent difficulty of measuring GDP accurately, we can say that these are essentially identical. They both basically doubled over those 36 years. (Though the U.S. growth path shows far more volatility.)

Comments
10 responses to “Europe vs. US: Who’s Winning?”
oldfaithless: “How were the benefits of growth distributed in Europe vs US?”
Some of the answer is here, showing “absolute” poverty rates:
http://www.asymptosis.com/us-poverty-were-2.html
In nine countries (including the US), 7.6% of households live on less than 32% of the US median. In the US, 12.4% live below that level.
Kenworthy has shown that transfer payments and social support are the primary reason for less inequality and poverty in developed countries.
Market-driven inequality/poverty is about the same, US versus Europe. Europe corrects for it with transfer payments and social support programs (health care, child care, etc.)
And they continue to grow as fast as we do. Go figger.
A related question: How were the benefits of growth distributed in Europe vs US?
[…] of my arguments: the US and Europe have been growing at the same rate for decades, despite huge disparities in tax burdens (28% versus 40% of GDP), and profound, […]
[…] But his choice of countries and periods for these scatterplots is opaque, based on a fairly abstruse statistical construct. He doesn’t select largely-similar countries for comparison, as I do, for instance, here. […]
Naive question: Is “income” defined consistently across countries? That is, do some countries only count payroll as income, while others include subsidies or the value of services?
(And, if you include the value of services, which services do you count? For example, one could argue that public libraries are a wash, because rich and poor both use them. But in my neighborhood, the two groups get very services from the library: the non-poor either don’t use the library at all, or they take advantage of services like “story time” and DVD borrowing, while the poor heavily use the free internet, the comfortable space, etc, which may have different monetary values that might suggest the poor benefit more than the non-poor from public libraries.)
Hi Wayne:
This post doesn’t actually address income, which is a quite variable term with many definitions that are useful in different contexts.
This is about GDP, which is also a somewhat problematic measure. But it’s measured pretty consistently across developed countries.
Oh and on your poor vs. rich: I’ve been working up a post over the last few weeks on “utility” as a measure of different policies’ merits, and how most cost-benefit analyses of policies don’t factor in the greater utility that each dollar buys for poor people.
[…] the higher-taxing countries, in aggregate, have been seen long-term growth that’s basically equivalent to […]
[…] Now that the OECD has updated their GDP data for 2010, I thought I should revisit the question I asked a few years ago: […]
[…] May 14, 2012 by admin Now that the OECD has updated their GDP data for 2010, I thought I should revisit the question I asked a few years ago: […]