I’ve been meaning to write up a post on this but haven’t found time. And it pretty much speaks for itself, so I’ll just give it to you and you can do with it as you will.
Congressional Seats by Top Donors to Each Seat
It’s pretty clear who wins that X vs. Y encounter: Big Money, 63% to 37%.
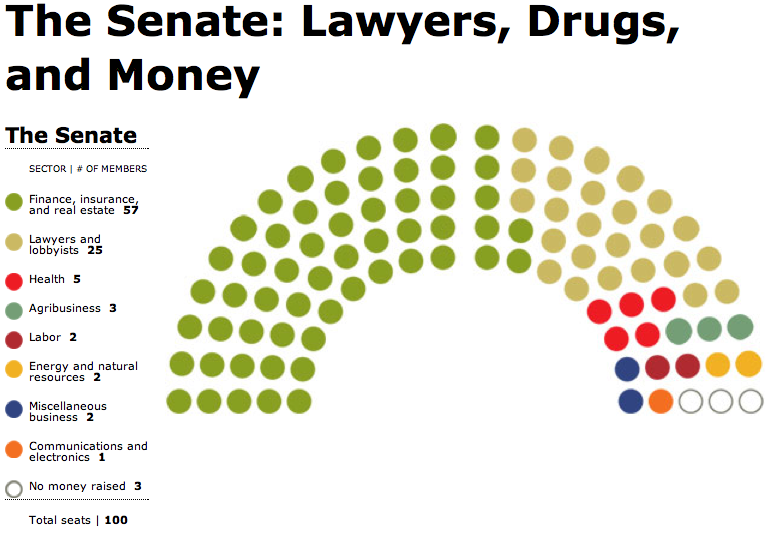
And in the Senate it’s not even close. Laughingly, ridiculously not even close:
I’m thinking senators must be bloody expensive, and labor just can’t afford to buy more than a couple — much less collect the whole set.
You don’t need to look much further to explain this.
Who Owns Congress? A Campaign Cash Seating Chart | Mother Jones.
Hat tip Barry Ritholz.

