Ask and ye shall receive. Roger Chittum sent me this:
Estimated correlations between sons’ and parents’ incomes, 1950-2000

Higher correlations, of course, mean lower mobility.
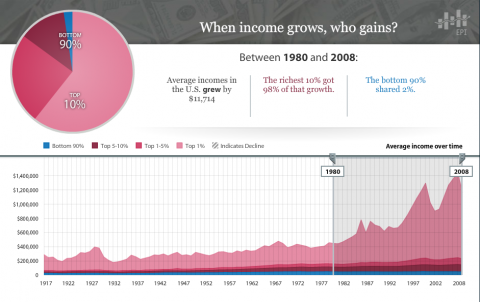
Why do all these inflection points land at 1980 (or just before)?
While you’re there, don’t miss this incredible interactive graphic:
Mobility decreasing in recent decades | State of Working America.

Comments
3 responses to “Trends in Intergenerational Mobility: Declining Opportunity Since 1980”
It was Roger Chilton who sent you the link on intergenerational mobility. I sent you the links on the Boltzmann Gibbs and the Pareto distributions. Roger’s links are quite educational as well.
Along the same thinking is – “Born on Third Base: The Sources of Wealth of the 1997 Forbes 400”
In 2010, Th bottom of the Forbes 400 was at $1.05B an increase from 1995 of 208 %. The CPI during the same time period only increased by 42%
Why do all these inflection points land at 1980 (or just before)?
Actually some are just after, but ca. 1980 is the inflection region for just about everything.
From WW II to ca. ’80 we had Keynesian policies about 75% of the time, Since, about 25%, and that only by accident.
http://jazzbumpa.blogspot.com/2011/02/accidental-keynesians.html
IMHO, anti-Keynesian – and specifically supply-side – policies have been the ruin of us all. Well, not all – there is that 1% . . .
JzB
[…] I have to make an exception here because he adds to my trove of graphs demonstrating how America today — after thirty years of Reaganomics policies […]