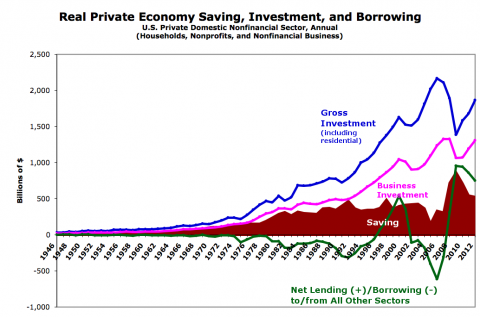
With all the chaff that’s been flying around (recently, and for years now) about saving and investment, dissaving, and lending/borrowing, I felt the need to go back to the numbers and see how they’ve played out over the decades in what we tend to call the “real” economy — domestic households and nonfinancial business. Click for larger:
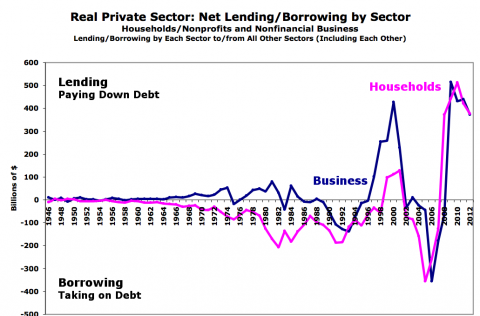
Update: The signs were reversed for lending/borrowing. Graphs corrected and updated.
Here’s the lending/borrowing broken out for you:
This is all from the Fed FFAs. Saving is household/nonprofit net saving (after-tax/transfer income minus expenditures) + undistributed business profits (after-tax/transfer income minus expenditures and distributed profits [distributed profits are part of household income]). Details/spreadsheet on request.
I’ve actually written at least three (long) posts on this in course of building out these graphs, but now that the graphs are complete I find myself fairly flummoxed. Saving seems to always be wildly insufficient to fund investment (and no, lending/borrowing + saving has no relationship either). S=I seems to provide exactly zero illumination here.
And the post-1990 lending/borrowing swings I see don’t fit with any real-sector saving/dissaving story I’ve heard (or can remember). We see borrowing spike during the internet boom, dive following the bust, then spike again during the real-estate bust. ?
So I’m going to leave this open to my gentle readers for the moment. What in the heck is going on here? What story (or stories) would you tell to explain what you see?
If anyone wants to see earlier periods zoomed in to get a better feel what’s going on, let me know. I’m thinking 1946-1975 (to see what seems like a period of consistency), and 1970-1990 (from the fall of Bretton Woods to the start of the internet bubble and the Clinton surplus).
Cross-posted at Angry Bear.


Comments
15 responses to “Saving, Investment, and Lending in the Real Economy (Graphs). S=I?”
[…] Cross-posted at Asymptosis. […]
This may be off track, but could you be comparing gross investment with net saving?
Have a look at flow of funds tables F9 and F10.
The reconciliation should work at either the gross or net level for both.
[…] As I showed in my last post, f you look at the “real” domestic private sector — households and nonfinancial […]
@JKH “gross investment”
I got a problem here, definitions of gross investment
I’ve always learned that:
Gross investment = total spending on new structures, equipment, and software (and inventory)
Viz: http://en.wikipedia.org/wiki/Gross_investment
IOW, capital expenditures.
But see here, page 53: http://books.google.com/books?id=YUZv_8BvlLAC&lpg=PA60&ots=rk0KK228WM&dq=%22flow%20of%20funds%22%20%22gross%20saving%22&pg=PA53#v=onepage&q=%22gross%20saving%22&f=false
Gross investment = Capital expenditures (not sure if that includes inventory changes) plus net financial investment (which includes Net Acquisition of Financial Assets and Net Increase in Liabilities)
What in the hell?
Is this a NIPA vs FFA issue?
@JKH:
On saving, here:
It is, quite explicitly, income minus expenditure for the two subsectors of this sector.
Households: income minus expenditures
Businesses: income minus expenditures (minus distributions, which are part of household income)
How is that not the saving of the sector?
I know: saving is defined as income minus *consumption* spending, in Kuznets’ attempt to model the use of real resources. (Ignoring the fact that in a 80% service economy where most of the resources are people’s work hours — which can’t be saved and used later if not used — most consumption does not deplete resources; it creates them!)
And businesses don’t do consumption spending. It’s all investment.
So by this thinking I should count all business spending minus distributed profits, not just their undistributed profits (saving) as saving.
But that would require that…we call all their spending…saving.
@Asymptosis
I have no idea what the full context is for that reference. Cherry picking requires contextual interpretation.
Have a look at F8 directly. It’s all broken down very cleanly. There is a clear distinction between gross domestic investment and the gross domestic saving that funds it. The difference is delineated as net lending, which corresponds roughly to the capital account surplus inflow at the national level. There’s no conflation of investment and net lending.
As I said, I suspect your issue on the graph is the difference between gross and net in the case of both investment and saving. And the gross/net components are broken down nicely in F8 and everything reconciles.
Obviously there are statistical discrepancies in a macro data collection exercise. They aren’t huge in this case and don’t impair the logical construction in any case.
@Asymptosis
“So by this thinking I should count all business spending minus distributed profits, not just their undistributed profits (saving) as saving.”
Undistributed profits is the business component of net saving. You have to add back depreciation (capital consumption) in order to get the corresponding component for gross saving, which is what corresponds to gross investment. See F8, where gross saving and net saving are clearly defined.
(This netting logic has nothing to do with the MMT net financial asset idea or more generally the net lending idea. It is about netting gross investment and saving for depreciation.)
@JKH:
>You have to add back depreciation (capital consumption) in order to get the corresponding component for gross saving
Right. Which would be the (almost? IVA, CCA, etc.) exact equivalent of counting all business spending as saving. Because businesses don’t do consumption spending, only investment spending.
So: we’re gonna call that spending saving.
Which pretty much puts me in agreement with SRW here. If we call investment saving, then the amount of S quite certainly equals the amount of I. Is that a useful construct?
Either that or you have to call (real) capital consumption saving. Adopt old Jewish guy wise-ass accent: Consumption is saving?
Did you see my piece a while back with the notion of “gross consumption”? Consumption spending plus capital consumption. (There’s a reason they call it consumption!)
And there’s a reason I think it makes a lot more sense to call net saving saving (it’s the addition to savings), and if anything, to call net investment (maybe “national”) saving, cause it’s the addition to the stock of real assets.
I really think all this confusion comes from that usage: calling gross investment (aka business spending) “saving.”
@Asymptosis
“Which would be the (almost? IVA, CCA, etc.) exact equivalent of counting all business spending as saving. Because businesses don’t do consumption spending, only investment spending.â€
Not at all. Spending apart from “investment spending” includes all business expenses – including cost of goods sold, cost of labor, cost of capital, and anything else that isn’t capitalized. It’s an income statement item of fundamental heft.
“If we call investment savingâ€
I’ve said a number of times now that I would never “call investment savingâ€. That’s not what the definitions and the equations mean at all. They are equations of magnitude – not equations of substance
Gross investment is a necessary concept to measure GDP. The gross/net breakdown flows from that. There’s no need to extract any of those beautiful apples.
@Asymptosis
This is lovely stuff. You should be enjoying all of it.
Perhaps a point could be made here about distinguishing between colloquial household finance language and the language of economics.
I’ve been assuming all along that this ongoing discussion has to do with economics. In colloquial finance, people often refer to stocks and bonds as investments and to money in the bank as savings.
This dual track perspective requires walking, chewing gum and patience, all at the same time – as opposed to forcible frontal lobotomy in the appropriate definition of economic saving.
I think the reader who is interested in economics should be guided by the generally sensible objective of wanting to ensure some consistency through the piece from micro to macro in terms of understanding economics. This requires consistent language and logical measurement concepts from micro to macro and vice versa. We can gradually walk that language when it comes to getting our heads around economics, while chewing gum along the parallel track of colloquial household finance language. And while we’re at it, we can interpose occasional reminders about the differences between the two.
But I’ve been assuming here that the objective in general has to do with understanding economics.
S = I is not deaggregated?
Haven’t you deaggregated?
Point taken.
But…the discussion really is about language that is useful and accurately (normatively?) representative in labeling of accounting constructs. And widespread usage can be pertinent to that discussion. Certainly not dispositive.
[…] As I showed in my last post, f you look at the “real” domestic private sector — households and nonfinancial […]
Let see if you were making a real direct investment what source of financing could be available that was not captured in the Fed Flow of Funds tables? Bank loans – no. Bond issues – no. Well could it be profits, earnings, or net operating surplus (as labeled in the GDI Accounts). Who would of thunked businesses would invest their profits back into their businesses. Hard to imagine that would happen. Never heard of that before but you can learn some new just about everyday.