Noah Smith asks what seems to be an interesting question in a recent post: “what leads to big recessions: wealth or debt”?
But I’d like to suggest that it’s actually a confused question. Like: is it the heat or the (relative) humidity that makes you feel so hot? Is it the voltage or the amperage that gives you a shock, or drives an electric motor? The answer in all these cases is obviously “Yes. Both.”
The question’s confused because wealth and debt are inextricably intertwined. “Wealth” is household net worth — household assets (including the market value of all firms’ equity shares) minus household sector debt. Debt is part (the negative part) of wealth.
Still, it’s interesting to look at time series for household-sector assets, debt, and net worth, and see how they behave in the lead-ins to recessions.
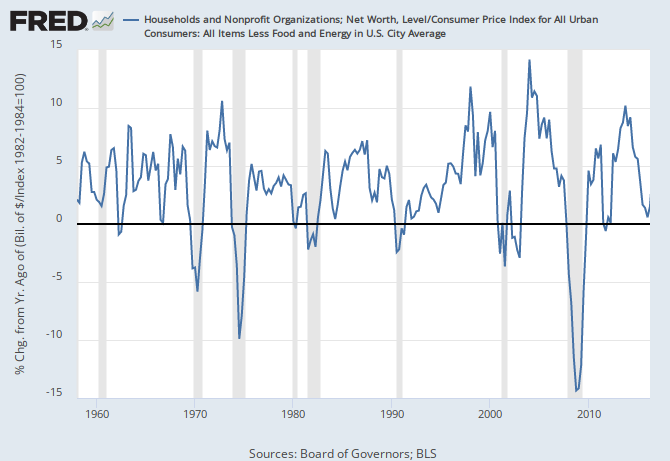
I’ve pointed out repeatedly that year-over-year declines in real (inflation-adjusted) household net worth are great predictors of recessions. Over the last 65 years, (almost) every time real household net worth declined, we were just into or about to be into a recession (click for interactive version):
Update 6/8: This was mistakenly showing the assets version (see next image); it’s now correctly showing the net worth version.
This measure is eight-for-seven in predicting recessions since the late sixties. (The exception is Q4 2011 — false positive.) It makes sense: when households have less money, they spend less, and recession ensues.
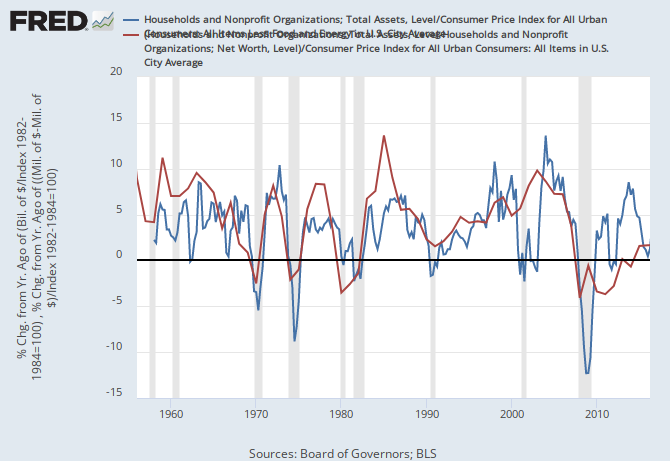
But now here’s what interesting: YOY change in real household assets is an equally good predictor:
Adding the liability side of the household-sector balance sheet (by using net worth instead of assets) doesn’t seem to improve this predictor one bit. This perhaps shouldn’t be surprising. Household-sector liabilities, at about $14 trillion, are pretty small relative to assets ($101 trillion). Even if levels of household debt make big percentage moves (see the next graph), the actual dollar volume of change isn’t all that great compared to asset-market price runups and drawdowns. Asset levels make much bigger moves than debt levels.
It’s also interesting to look at changes in real household-sector assets (or net worth) compared to changes in real household-sector liabilities:
As we get closer to recessions, the household sector takes on debt progressively more slowly, with that shift happening over multiple years. (2000 is the exception here.) That speaks to a very different dynamic than the sudden plunges in real assets and net worth at the beginning of the last seven recessions. Perhaps: household’s portfolios are growing in these halcyon days between recessions, so they have steadily less need to borrow. And as those days continue, they start to sniff the next recession coming, so they slow down their borrowing.
My impressionistic take, unsupported by the data shown here: Higher levels of debt increase the odds that market drawdowns will go south of the border, driving the economy into recession. And they increase the likely depth of the drawdown, as lots of players (households and others) frantically need to shrink and deleverage their balance sheets, driving a downward spiral.
If the humidity’s high, and it gets hotter, you’re really gonna notice the change.
My obstreperous, categorical take, cadging from the past master of same:
Recession is always and everywhere a financial phenomenon.
Cross-posted at Angry Bear.


Comments
One response to “Noahpinion: What Causes Recessions? Debt Runups or Wealth Declines?”
[…] three recessions. It happened again at the end of 2015. Moreover, growth in household net worth has slowed to zero, a shift that has also coincided with past […]