Harold Myerson today in the Washington Post bemoans America’s dependence on our own shopping as an engine of the economy. Household consumption accounts for 70% or our GDP. I checked his numbers and he got them right:
Britain ranked second among nations in the Organization for Economic Cooperation and Development, at 61 percent, then came Italy, at 59 percent, with Japan, Germany, France and Canada all hovering around 55 percent.
The average for OECD countries minus the U.S. is 56%. The U.S. percentage hasn’t been below 65% in the last thirty years. Long-term, our real competitors in this game are those thriving engines of prosperity, Greece and Portugal.
Myerson’s argument makes all kinds of sense to me, and to many others: If we want high-wage jobs, we need to be creating value that we can sell to others, rather than running on our own (not-so-little) treadmill fed with pellets from China.
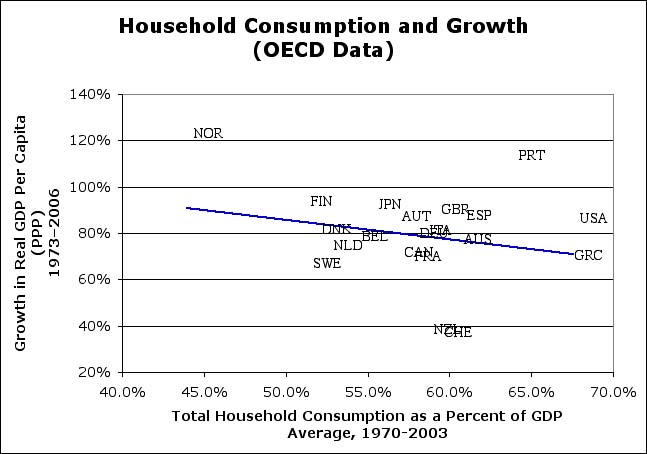
It may seem obvious, but I never trust my idle intuition. So I grabbed the OECD data and plotted it out.

(CHE is OECDese for Switzerland. Note that–since I was trying to evaluate what’s good for the U.S.–I selected OECD countries that are most like the U.S. I’ve lagged consumption period by three years because presumably it would take some time to affect the economy. Ditto for the table below.)
The data seems to bear out Myerson’s (and my) intuition. Countries that generate more of their GDP from domestic consumption seem to generate prosperity more slowly than their less-consumptive counterparts. The slope isn’t very steep. It has a correlation of .24–pretty good by SocSci standards, but with only twenty countries it’s not “statistically signficiant to the tenth percentile.” .29 would make the grade.
But it gets more interesting–and more significant–when you look at a lot of different periods. (Who says the periods above are definitive?) Here are the correlations for different periods. Red means bad: that higher household consumption percentages correlate with slower growth.
|
|
1980 |
1985 |
1990 |
1995 |
2000 |
2005 |
|
1975 |
-.18 |
-.46 |
-.15 |
-.21 |
-.23 |
-.24 |
|
1980 |
|
-.55 |
-.18 |
-.26 |
-.28 |
-.23 |
|
1985 |
|
|
.14 |
-.03 |
-.05 |
.04 |
|
1990 |
|
|
|
-.23 |
-.23 |
-.01 |
|
1995 |
|
|
|
|
-.08 |
.10 |
|
2000 |
|
|
|
|
|
.24 |
Starting years on the left, ending years along the top. Not huge numbers or high statistical significance for each result (more so in aggregate), and it doesn’t prove causation, of course. But if someone were to tell me that a high household-consumption percentage was good for growth–except in the short term–I’d be hiring a new economist.
Again, it probably seems obvious. But the percentage differences between countries aren’t anything like the differences in tax rates. And those tax differences don’t seem to affect growth much at all. These much smaller differences seem to affect growth quite a bit.
I know you were all wondering…