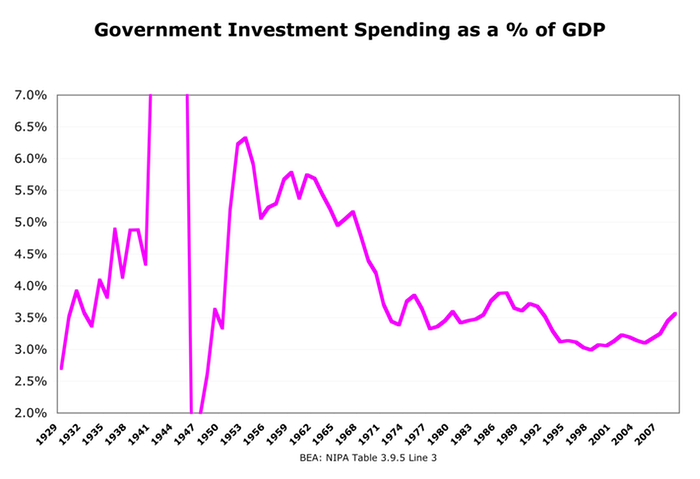
Does this look like a smoking gun to you? To me, at least, it looks like a very likely contributor to the stagnation of prosperity growth that we’ve seen since the 70s.
This is fed, state, local spending combined. I’ve cut off the top and bottom to concentrate on the post-war period, and because earlier years were wildly volatilized by the Depression and the war.
From ’52 to ’68 — sixteen years — government was quite literally investing in America, to the tune of >3% of GDP annually.
Over the next sixteen years that commitment to future prosperity steadily decayed. By the fourth year of Reagan’s term we were spending 1.8% of GDP — a 42% drop from 1968 levels, down 48% from the peak in 1958. It’s been floating around that low level for the last 26 years.
Update: This graph shows an even greater decline — total government investment spending, including structures, hardware (equipment), and software.
If you saw this graph for a business’s investment in fixed assets — with a graph of profits that follows right along with it — what would think about its prospects for long-term growth?


Comments
13 responses to “Government Investment and the Post-70s Prosperity Gap”
Graphs with transparent backgrounds are hard to read.
x: I’m very curious what you’re seeing. In my browser there’s a white background, so the transparency is invisible, so to speak. ??
I see a purple line on solid black. IE (6) uses the background color for windows to display transparent images, so even changing the background color in IE does not make a change in the image. The same is true of most external image viewer programs.
Using Transparency in images is always a bad idea. You never know how a users computer is set up.
Fascinating, in the mean time total Govn’t spending as a percentage of GDP (local, state, fed) has steadily risen.
http://www.usgovernmentspending.com/downchart_gs.php?year=1903_2010&view=1&expand=&units=p&fy=fy12&chart=F0-total&bar=0&stack=1&size=l&title=US%20Government%20Spending%20As%20Percent%20Of%20GDP&state=US&color=c&local=s
@Chris T
That increase in total outlays is all medicare and SS.
Govt consumption exps have been flat since the 70s:
http://www.asymptosis.com/government-consumption-spending-revisited.html
Consumption has been steady, while investment dived.
Are you equating government purchase of a building or a computer with business investment? If the effort is to measure government’s contribution to GDP growth, one would want to look at programs which foster improved education, technological innovation, and of course rescuing the economy from disaster. None of these are “investment” as defined in the NIPAs, right?
No on the former, yes on the latter. Purchases of structures do not contribute the stock of fixed assets or GDP, anymore than purchasing shares of stock — they’re asset swaps. (Building a structure quite otherwise.) A computer? You bet.
Correct. Ditto with a business spending money on training, or all the costs associated with rolling out a new inititiave like just-in-time inventory — creating procedures and policies, informal peet-to-peer training, etc. Whether it’s business or government, the NIPAs don’t account for the creation of “organizational capital,” much less “social capital” — trust, good will, etc.
Bloody hard things to measure.
I’ve been meaning to pull this graph for govt consumption and capital expenditures on education — which *both* seem like investment to me. Wonder what that will show.
@Asymptosis
Federal expenditures on education have increased substantially over the last fifty years. Education used to be something left only to the states; federal involvement is a recent phenomenon.
@Chris: “Federal expenditures on education have increased substantially over the last fifty years.”
A lot of that is probably via grants in aid, so spent by the states. (Would they spend less from their budgets as a result? Seems like…) I gotta get around to graphing total government spending on education. (Perhaps split out consumption versus investment?)
@Chris T
Federal spending as a percentage of GDP has not risen monotonically. It declined slightly during Reagan admin; declined markedly during Clinton/GOP Congress; was flat after 2001-2 recession and economic sluggishness until the next recession. Spending as a percentage of GDP correlates with economic cycle, for obvious reasons (recessions kill revenues).
@Bob White
All true. But look long term. With the exception of:
1. Social security (which pays for itself, and will continue to do so with small tweaks in revenues),
2. Interest (the legacy of not paying our bills since 1981, except in the 90s), and
3. Medicare (it’s all about health-care cost inflation)
The long-term budget has been basically flat-to-declining since the 70s:
http://www.asymptosis.com/government-consumption-spending-revisited.html
[…] Pay off some of our national debt, invest in productive infrastructure to build true national wealth, greatly expand the EITC (and index it to unemployment) to […]
[…] Stagnation (the slowdown in economic growth since the mid-70s)? Here’s what looks like a smoking gun: Government investment spending as a percent of GDP fell off a cliff from the 50s/60s to the 80s […]