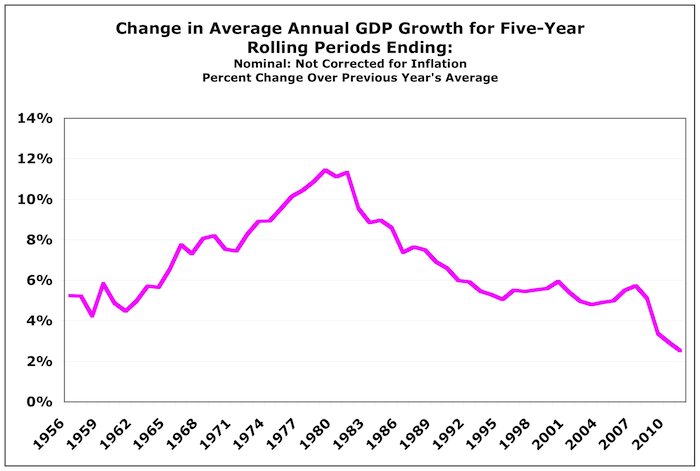
I was poking around in data as is my wont, sussing things out, and put the following graph together. It quite caught my eye. The five-year averages make it a lot easier to see the big picture.

At first glance this looks like a profound secular shift in the economy. (Tyler Cowen: Wow, that is a big drop in innovation!) And a political hack/Reaganomics basher like me can’t help but point out that the peak is in ’81.
But of course there’s a big inflation story that’s not told here. A simple version: the Fed lost control of inflation, then it regained control.
But still: is there a story having to do with the Fed’s diminished expectations here? Was it reasonable to lower those expectations (so far)? Why? Any woulda shoulda couldas?
Other stories? I’d love to hear thoughts from some of those smart people in the Scott Sumner NGDP-level-targeting cabal.
What would Scott Sumner (have) do(ne)?
Comments
3 responses to “Quasi/Market Monetarists: Will You Tell Me a Story?”
I took a shot at correcting for inflation. There definitely still is a regime change in 1981-82.
Not sure if we used the same methodology. I’ve described mine in detail.
http://jazzbumpa.blogspot.com/2011/10/different-look-at-real-gdp.html
Cheers!
JzB
Volcker Mountain.
NGDP targeting may be a good way to prevent deflation. I don’t see how it does much for growth.
Before the Fed “lost control of inflation” and again from the mid-’90s to the Crisis, your graph shows NGDP running about 5%. I do not see “the Fed’s diminished expectations” in that.
Good point.