In my previous post, I replied to Martin Sandbu’s interesting response to my (and Matthew Klein’s) previous posts on holding gains, income, saving, and wealth. Here some more (accounting-dweeby) thinking on the subject, which I post here to avoid clogging the previous and making it even more overlong.
Another way to explain this issue: I think Martin is valorizing book-value accounting over mark-to-market, market-cap accounting, as accurately depicting the “real” value of all our stuff (our “capital,” if you must…).
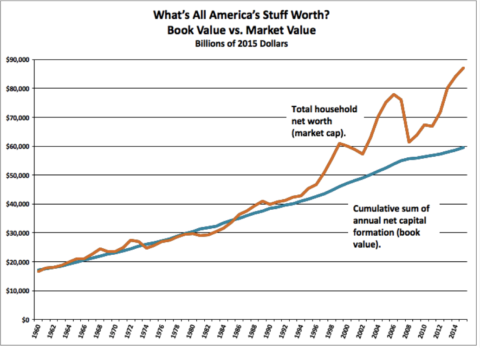
Book-value accounting uses the “perpetual inventory” accounting method: every year you tally up gross investment — spending to purchase long-lived goods — and subtract an estimate of depreciation or “consumption of fixed capital,” to yield net investment — that year’s increase in our “inventory,” or “capital stock.” The cumulative sum of past years’ net investment is today’s book value. It’s the markets’ (and accountants’) estimate of our stuff’s worth, based on the market prices that prevailed when those goods were bought/sold — what the markets for newly produced goods thought those goods were “worth.”
Mark-to-market accounting is also a market estimate of our stuff’s value. But a different market: today’s market for existing assets (with, by the way, much less intervention and estimation by accountants; think: depreciation tables). This estimate, looked at year to year, inevitably requires you to consider holding gains.
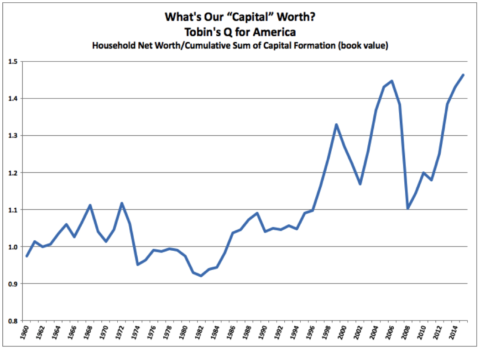
Econ 101 would tell you that those two measures, estimates, should move together; why would anyone pay more than a firms’ book value for its equity? And from 1960 to about 1990 (my data from the IMAs starts in 1960), they did move together, with a Tobin’s Q ratio around one. That’s very much not true since 1990.
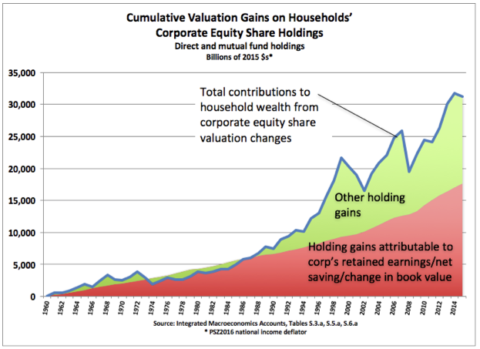
Sorry, I haven’t assembled an equivalent to the third graph for real estate, the other big category of household holdings. Having seen similar, though, I’m quite confident you’d see the same pattern there, quite possibly far more pronounced.
These two measures of what our stuff is worth have diverged wildly from previous, and from what Econ 101 would predict.
I can think of three explanations:
1. Existing-asset markets think (correctly) that we’ve been wildly underestimating GDP. (What are the implications for measures of productivity — GDP/hours worked?)
2. Existing-asset markets are wrong about that, and the mother of all asset-price crashes is imminent.
3. The asset/wealthholding class has gotten much better at extracting value from nonwealthholders (domestic and international), and the resulting higher returns to that class are NPV-capitalized into the prices of their owned assets. Recent decades’ few percentage points increase in “capital share” would magnify hugely via that long-term discounted capitalization.
#3 suggests something that an unfortunately small number of economists have been saying for a very long time: it’s impossible to even think coherently about economics, and how economies work, if you’re not thinking about the distribution/concentration of wealth and income.


Comments
3 responses to “Wonky: More on Martin Sandbu’s “Pseudo” Income and Saving”
If you think we’re understating GDP, I would think the argument from most would be that inflation is overstated. So why not simply do the analysis on a nominal basis instead of a real basis?
Also, i think you’ll find that for at least the last two decades your “Q” will closely match consumer confidence…suggesting valuation plays a role.
@Effem “argument from most would be that inflation is overstated”
Possible, but that doesn’t explain graph #3. Same index applied to the two series.
“So why not simply do the analysis on a nominal basis instead of a real basis?”
Can’t cumulatively sum nominal over years, and compare it meaningfully to a this-year amount.
[…] address this from another, wonky angle — book-value versus mark-to-market, market-cap accounting, here. (Includes empirical […]